
k6 Studio: Simplify Load Testing with a Powerful Visual Interface
Getting started with performance testing just got easier! k6 Studio is a free, open-source desktop application designed to help you generate, customize, and debug k6 test scripts

Getting started with performance testing just got easier!
k6 Studio is a free, open-source desktop application designed to help you generate, customize, and debug k6 test scripts—all without needing deep JavaScript expertise.
Instead of manually writing scripts, k6 Studio lets you record real browser interactions, convert them into test scripts, and fine-tune them using an intuitive visual interface.
With built-in tools to validate and debug your scripts, you can ensure smooth performance testing before running full-scale load tests with the k6 CLI, Grafana Cloud k6, or Synthetic Monitoring.
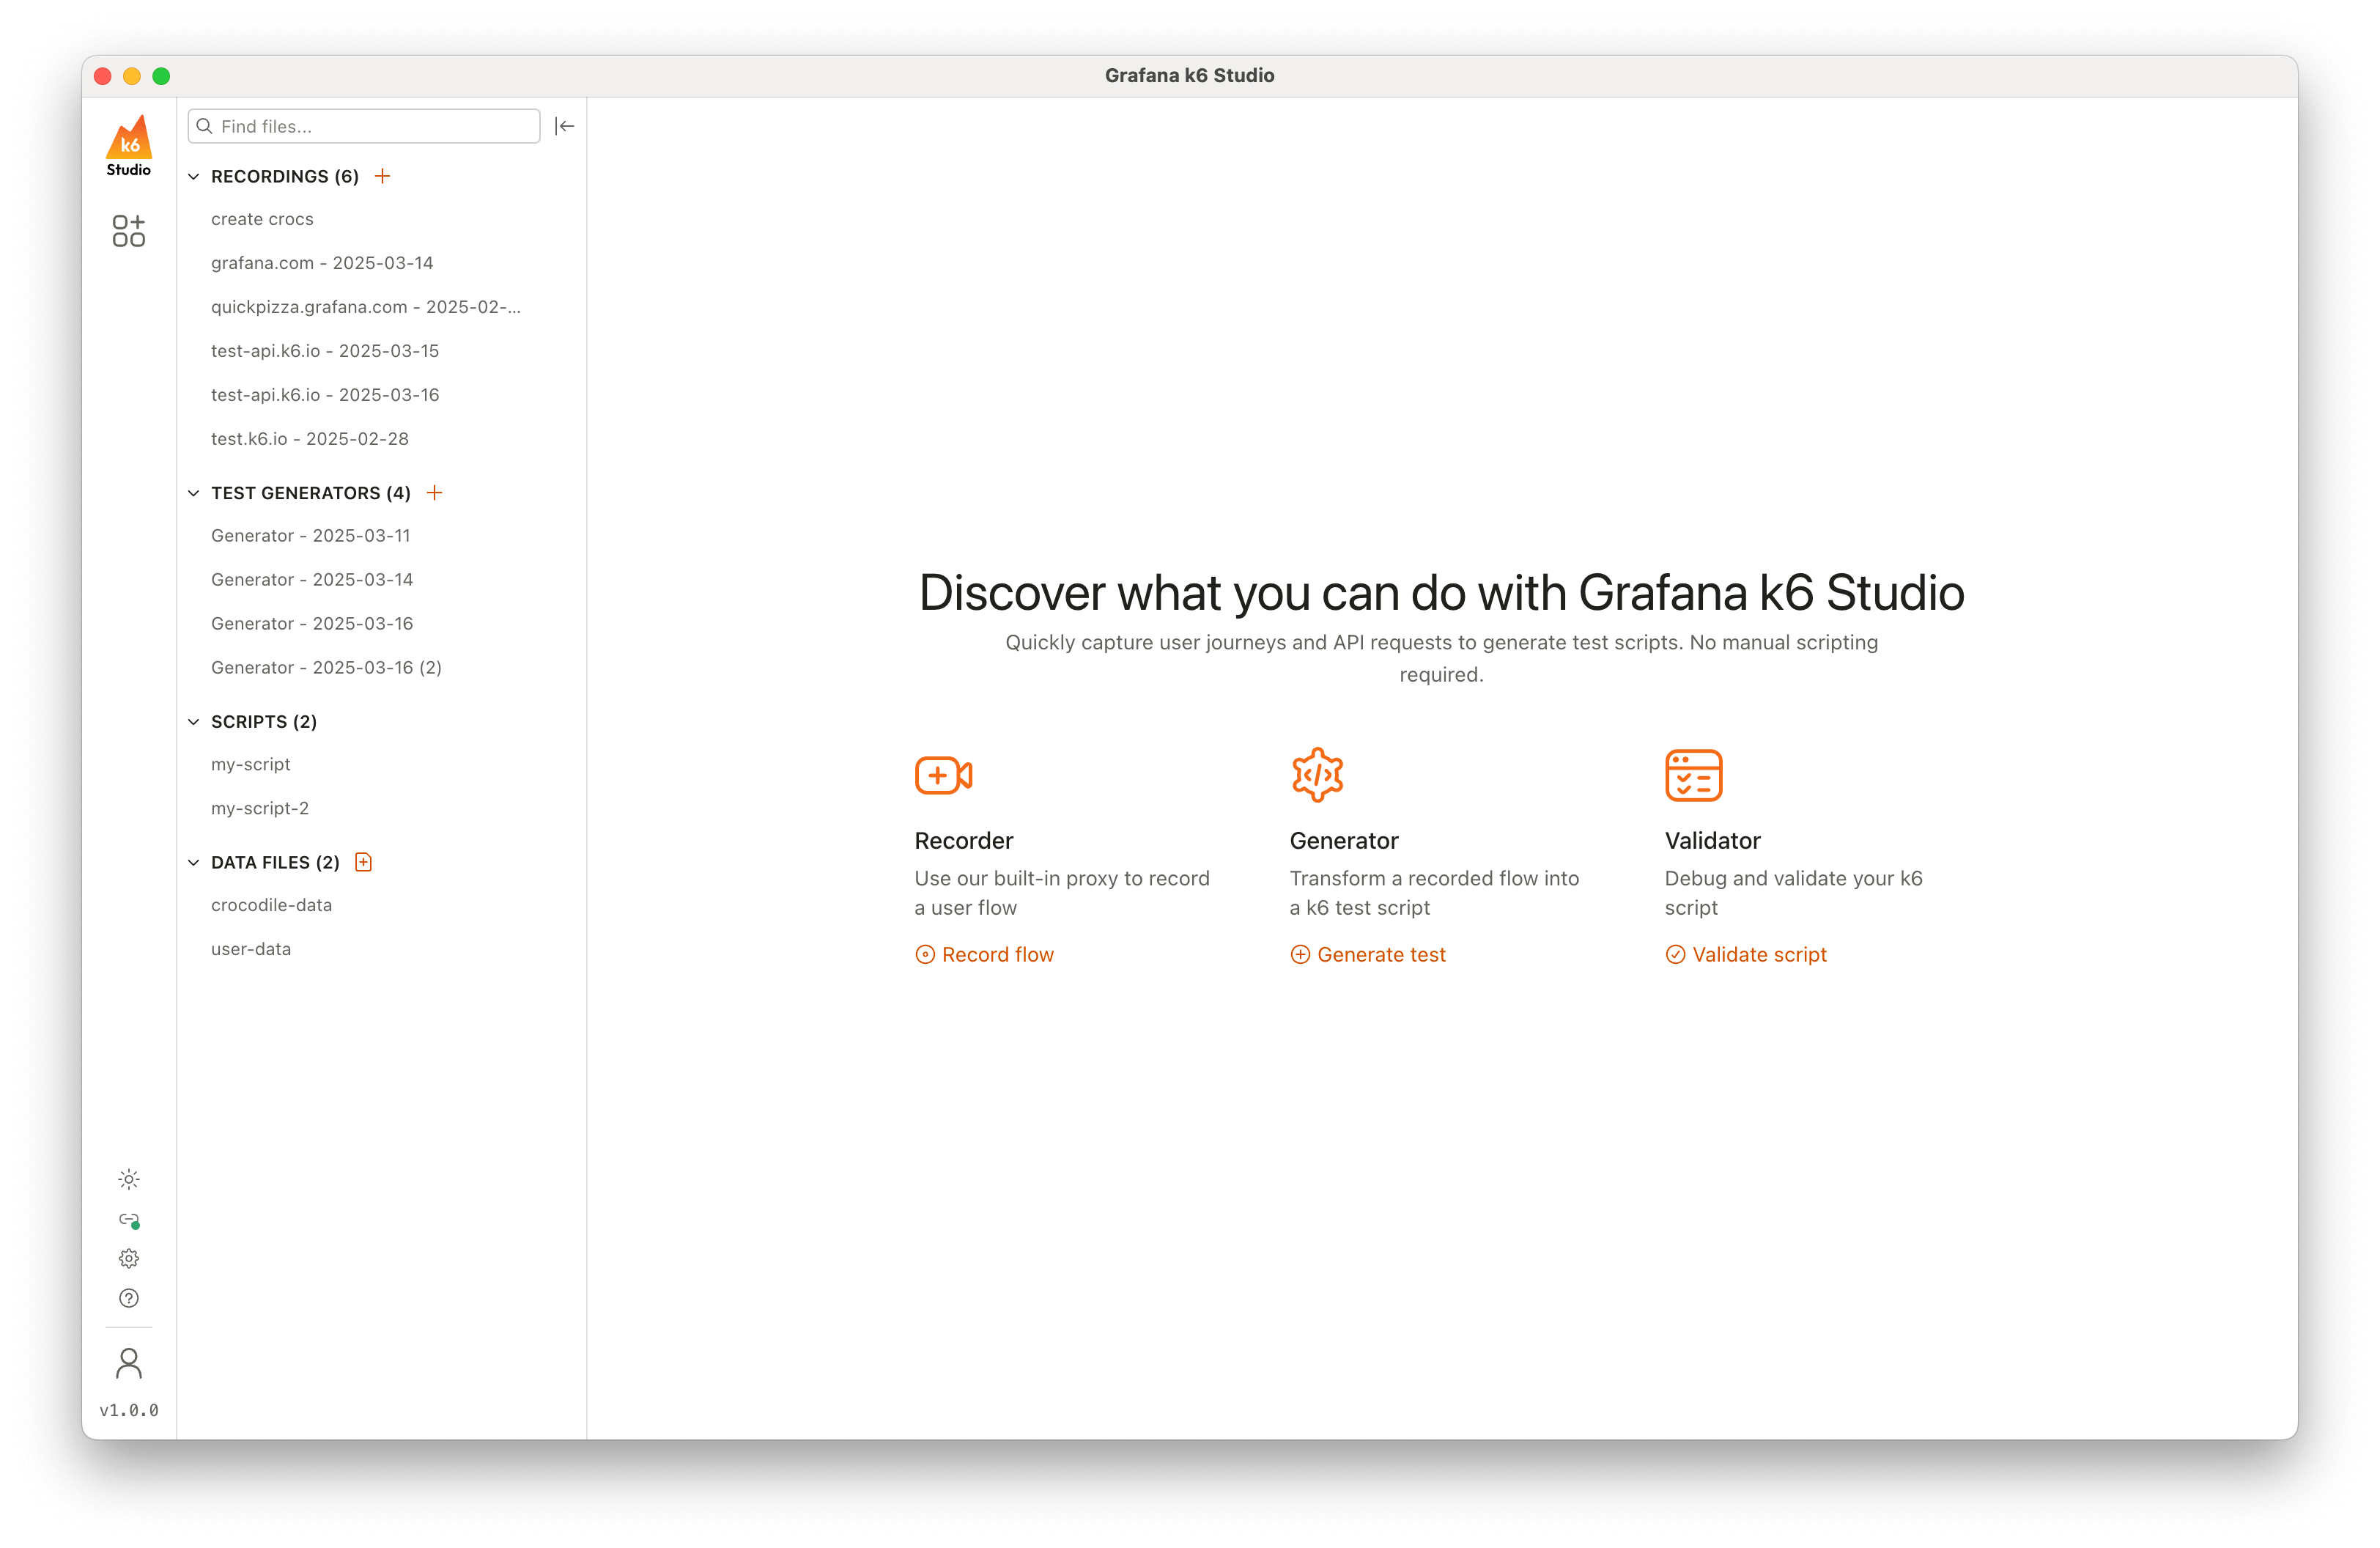
Here’s what makes k6 Studio a game-changer.
Just 3 easy steps
🔹 Record – Capture user interactions and generate a HAR file effortlessly.
🔹 Generate – Convert recordings into test scripts with easy-to-use customization options.
🔹 Validate – Debug and inspect requests before running full load tests.
But first installation
So let us have a look at each step, but first installation.
Since I am on a Windows machine i am going to present those steps to you. Installation is also really easy
To install k6 Studio on Windows:
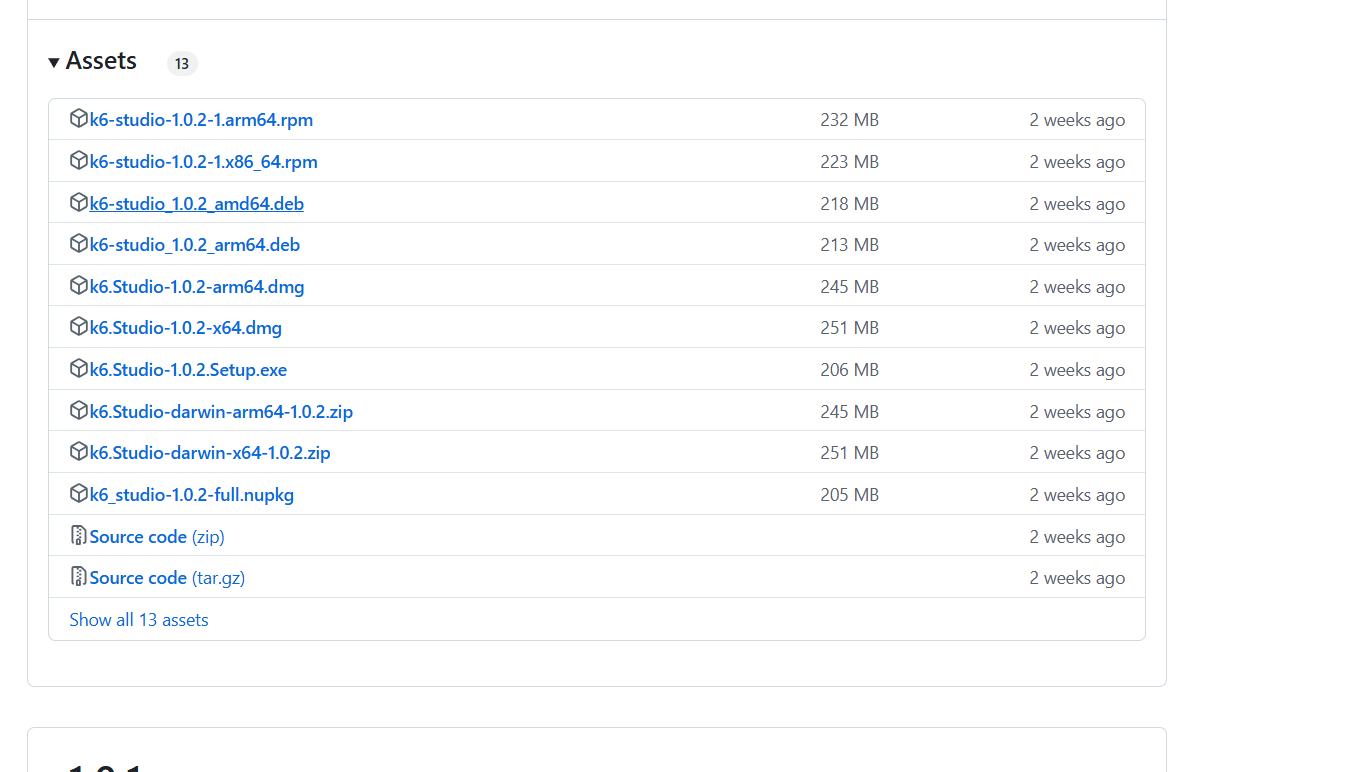
Go to the Releases page in the k6 Studio GitHub repository.
Download the executable file for Windows: k6.Studio-{VERSION}-Setup.exe.
After the download finishes, open the executable file.
For linux an Mac check the oficial documentation
Record your test
With the Recorder, you can initiate a recording session that launches a browser window, allowing you to navigate through a website or application while k6 Studio tracks every request and response. Once you stop the recording, a HAR file is generated, providing a detailed log of the captured interactions. This file can then be analyzed to ensure the recorded user flow accurately reflects the intended test scenario and serves as the foundation for your test script.
Exploring the Recorder Window
The Recorder window presents a structured interface for managing and analyzing test recordings. Key elements include:
Test Recording Name: Each recording and its associated HAR file are automatically named, but you can rename them for better organization.
Recorder Actions: Located at the top-right, these buttons allow you to:
Start a new recording
Stop an ongoing recording
Discard a recording and start over
Generate a test script from a completed recording
Recorder Options:
Requests: Displays the total number of recorded requests.
Show Static Assets: A toggle to include or hide static asset requests in the list. These are hidden by default.
Search: A powerful search box that allows filtering requests by headers, cookies, payloads, response data, URL, method, or status code.
Requests and Groups List: Shows a chronological list of requests, including method, status code, host, and path. Requests can be grouped for better organization, with collapsible sections for easy inspection.
Request and Response Inspector: Clicking on a request opens a detailed panel on the right, displaying essential request and response data, such as headers, payloads, cookies, and content.
With the k6 Studio Recorder, capturing and analyzing user interactions becomes seamless, enabling developers and testers to build more reliable and effective performance tests.
Generate the test
The k6 Studio Generator simplifies the process of building performance tests by converting your test recordings into editable test scripts through a visual interface—without writing JavaScript manually.
It provides intuitive tools for modifying test behaviors, setting performance criteria, and inserting custom logic into test scripts.
Exploring the Generator Window and options
The Generator window includes:
Generator Name & Actions: Automatically generated names can be renamed. Actions include selecting a recording, saving changes, validating scripts, exporting, or deleting the generator.
Requests and Script Inspector: Displays requests from the recording, organized by execution order, with inspection options for method, status code, host, and path.
Generator Options: Tools to configure load profiles, test rules, variables, and allowed hosts.
From the generated script there are a lot of options that you can review and customize in order to make your script more specific and more suitable for your use case.
These include:
Load Profile
You can control how virtual users (VUs) execute the test:
Ramping VUs: Adjusts the number of VUs over time.
Shared Iterations: Runs a fixed number of iterations split among VUs.
Each profile supports different variable setups to fine-tune execution behavior.
Thresholds
Set performance pass/fail conditions. These thresholds are essential for defining Service Level Objectives (SLOs), such as response times or request success rates. Failing a threshold can optionally stop the test run.
Think Time
Simulates realistic user behavior by adding delays between requests or groups, mimicking actual browsing or interaction habits.
Load Zones
Configure geographical zones to distribute traffic. Load zones are particularly useful when testing global application performance and are only applicable to tests run on Grafana Cloud k6.
Definition of testing Rules
Verification Rule
Ensures responses match expected status codes based on the recording. Failed checks don’t interrupt tests but help diagnose issues post-run.
Correlation Rule
Extracts and reuses values like tokens or session IDs across requests. You can define where to extract (headers, body, URL) and how (Begin-End, Regex, JSON path).
Parameterization Rule
Replaces static values in requests with variables, data file values, or custom code. Useful for user-specific actions or randomized testing.
Custom Code Rule
Lets you inject JavaScript code snippets before or after selected requests. Ideal for implementing logic not supported by default rules.
The k6 Studio Generator offers a comprehensive, user-friendly interface for crafting detailed performance tests. With its visual editor and robust rule system, it's easier than ever to simulate real-world traffic and validate your application's resilience under load.
Validate
The k6 Studio Validator is a powerful tool designed to ensure your test scripts run smoothly and deliver expected outcomes. It allows you to execute a single iteration of your test, offering a clear view of every request and its corresponding response, along with detailed logs and check metrics. Importantly, the Validator works with any k6 test script—not just those generated within k6 Studio—making it an essential part of your performance testing toolkit.
Overview of the Validator Interface
The Validator window is structured to give you complete insight into the test script execution. Here’s what you’ll find:
Test Script Name & Validator Actions: At the top of the interface, the name of your test script is displayed. Action buttons allow you to run a single test iteration with the “Validate script” option, execute tests on Grafana Cloud using “Run in Grafana Cloud,” or manage your test scripts through options like opening external scripts and deleting scripts.
Validator Options: Located just below the script name, these options provide a summary of the test run:
Requests Count: See the total number of requests executed.
Search Functionality: Easily search requests by URL, HTTP method, or status code. An additional toggle lets you search across all request data.
Requests and Groups List: The executed requests and their groupings are listed in chronological order. Each request displays key details such as method, status code, host, and path. You can expand or collapse groups for easier navigation.
Request and Response Inspector: Clicking on any request opens a panel that shows the detailed headers, payload, cookies, and content of both the request and response.
Logs, Checks, and Script Inspector: Separate tabs provide access to logs generated during the test, check results to confirm if the outcomes meet your expectations, and a preview of the script that was executed. This detailed view is crucial for debugging and understanding test behavior.
Let us run it
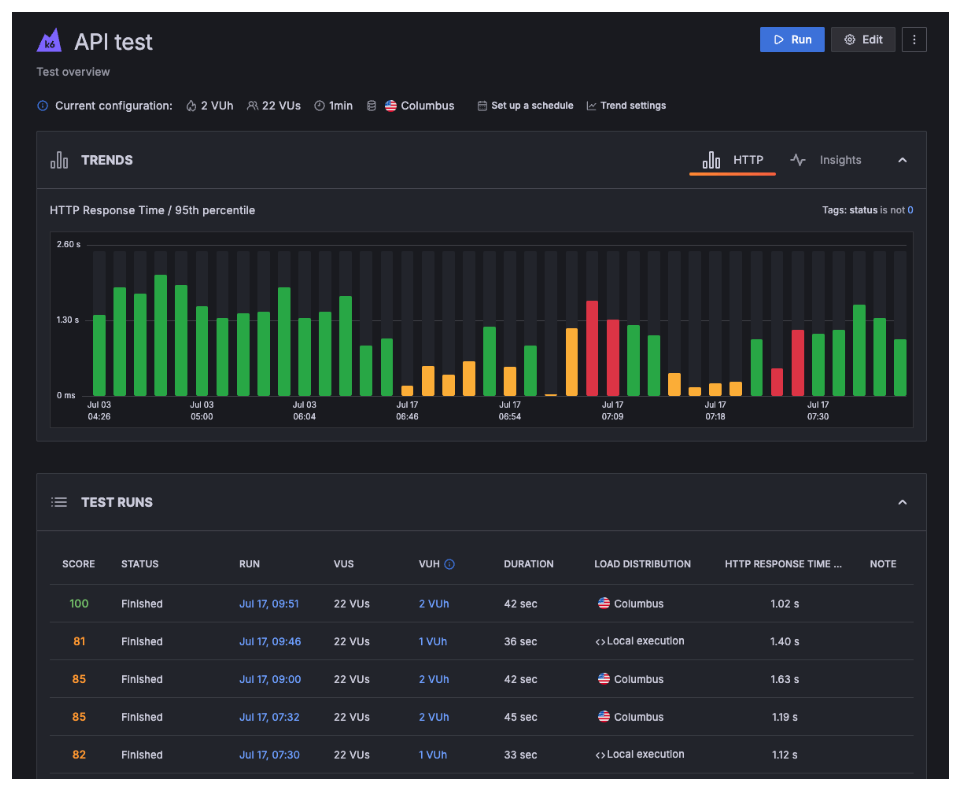
Once you changed your test as you wanted you can run it using Grafana Cloud.
Setting up and running tests in Grafana Cloud k6 is straightforward—from authentication and stack selection to execution and result analysis.
With these capabilities, you can ensure your application meets performance expectations before it reaches your users.
k6 Studio takes the complexity out of creating and testing k6 scripts by offering a powerful, user-friendly visual interface. Whether you're a beginner trying to get started or an experienced developer looking to save time, k6 Studio helps you go from browser recording to a fully functional k6 script in just a few clicks.
With features like the Recorder, Generator, and Validator, you can easily capture real user flows, customize scripts with precision, and debug them with confidence—all without leaving the desktop app.
Once your script is ready, you can run it using the k6 CLI, Grafana Cloud k6, or Synthetic Monitoring to gain valuable insights into your application's performance.
Start using k6 Studio today and take your load testing workflow to the next level—faster, easier, and more visual than ever before.